

Updated Date:
Grafana Mimir is an open source, horizontally scalable time series database designed for long-term storage of Prometheus and OpenTelemetry metrics. Built on a microservices architecture, Mimir provides high availability and multi-tenancy, while remaining compatible with Prometheus’ remote write API and PromQL. Data can arrive from Prometheus itself, Grafana Alloy, or an OpenTelemetry Collector, making Mimir a natural long-term storage backend regardless of which instrumentation stack you’ve standardized on.
Core Architecture
Mimir follows a microservices-based design where all components are compiled into a single binary. The (-target) parameter determines which component(s) the binary runs, allowing for flexible deployment patterns. For simpler deployments, Mimir can run in monolithic mode (all components in one process) or read-write mode (components grouped by function).
The architecture consists of stateless and stateful components. Most are stateless, requiring no persistent data between restarts, while stateful components like ingesters rely on non-volatile storage to prevent data loss.

Stateful ingesters with local write-ahead logs to manage ingestion of new data and serving recent data for queries
Kafka as a central ingest pipe to decouple the read and write operations
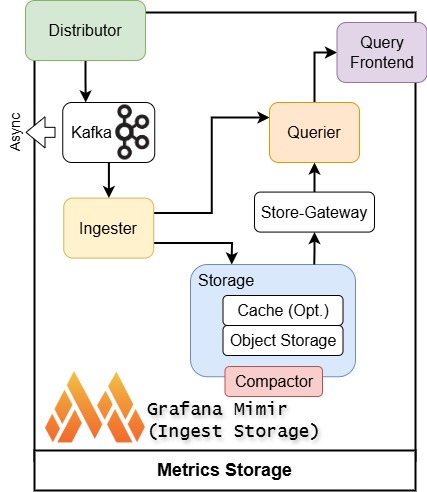
Two Architectures: Classic vs. Ingest Storage
Starting with Mimir 3.0, Grafana offers two supported architectures, and the choice materially changes how the write path behaves.
Classic architecture is the original design: ingesters are stateful, holding both an in-memory head block and a local write-ahead log (WAL), and a write only succeeds once a quorum of ingesters has acknowledged it. This is straightforward to reason about, but it means heavy query load and heavy write load compete for the same ingester resources — a noisy-neighbor problem that Mimir operators have run into for years.
Ingest storage architecture is now the preferred, stable option. It inserts Apache Kafka (or a Kafka-compatible system) as a durable buffer between the write and read paths. Distributors shard incoming samples across Kafka partitions and consider the write successful once Kafka confirms persistence and ingesters are no longer in the critical path for writes at all. Ingesters instead consume continuously from their assigned partition, in the background, and use that stream to build the same on-disk TSDB blocks as before. This decouples read and write load almost completely, which is the main reason Grafana now recommends it for new deployments and plans to deprecate classic architecture in a future release.
The rest of this post describes ingest storage architecture unless noted otherwise, since that’s what new deployments should use.
The Write Path (Ingest Storage Architecture)
- Distributors receive incoming samples via Prometheus’ remote write API or from an OpenTelemetry Collector. Requests are Snappy-compressed Protocol Buffer messages tagged with a tenant ID for multi-tenancy.
- Distributors shard each request’s series across Kafka partitions within a topic, and briefly buffer before producing to the Kafka brokers.
- Kafka durably persists the write and, depending on configuration, replicates it across brokers. Once Kafka confirms persistence, the distributor acknowledges the write back to the client. Note that at this point the write path is done and ingesters haven’t touched the data yet.
- Ingesters consume continuously from Kafka, one partition per ingester, and append records to an in-memory per-tenant TSDB and a local WAL, just as before. Multiple ingesters across separate zones consume the same partition so a zone failure doesn’t interrupt reads.
- Every two hours by default, in-memory samples flush to disk as TSDB blocks, the WAL truncates, and the block uploads to long-term object storage. Each ingester still needs its WAL on persistent disk (AWS EBS, GCP Persistent Disk, or a Kubernetes StatefulSet with a PVC) to recover cleanly from a restart.
Because ingesters consume asynchronously, there’s a small delay that is typically under a second between a write reaching Kafka and it being queryable. For most dashboards this is invisible, but it matters for Mimir’s own ruler, which needs earlier rules in a rule group to be visible when evaluating later ones. Mimir handles this with an X-Read-Consistency: strong header: when set, the query-frontend fetches the latest Kafka offsets and ingesters wait until they’ve caught up before answering. The ruler sets this automatically where needed.
Replication and Compaction
Replication works differently depending on architecture. In classic architecture, each time series is synchronously replicated to three ingesters as part of the write itself. In ingest storage architecture, Kafka is responsible for replication and durability on the write path, and each ingester independently writes its own block from what it consumes. Either way, this means multiple overlapping blocks land in object storage with one per ingester replica. The Compactor merges these blocks, removes duplicate samples, and significantly reduces storage utilization. This step is architecture-agnostic and unchanged by the choice of classic vs. ingest storage.
The Read Path
Queries follow a different path optimized for performance:
- The query-frontend receives incoming queries and splits longer time-range queries into smaller chunks
- It checks the results cache to return cached data when possible
- Non-cached queries are placed in an in-memory queue (or in the optional query-scheduler)
- Queriers act as workers, pulling queries from the queue
- Queriers fetch data from both store-gateways (for long-term storage) and ingesters (for recent data)
- Results are returned to the query-frontend for aggregation before being sent to the client
For very large or high-cardinality queries, Mimir can also apply query sharding, splitting a single PromQL query into smaller pieces that queriers execute in parallel before the query-frontend merges the results similar in spirit to how long time ranges are split, but along the series/label dimension instead of time. Grafana has also introduced a new Mimir query engine designed to avoid unnecessary inverted-index lookups in Prometheus TSDB, which has cut querier memory usage significantly in Grafana’s own testing.
Storage Format
Mimir’s storage format is based on Prometheus TSDB. Each tenant gets their own TSDB, with data persisted in on-disk blocks covering two hour ranges by default. Blocks contain:
- An index file mapping metric names and labels to time series
- Metadata files
- Time series chunks (typically storing ~120 samples per chunk)
Mimir also supports Prometheus’ native histograms, a more storage- and query-efficient histogram representation than the traditional bucket-per-series approach, including a mapping from OpenTelemetry’s exponential histograms. If you’re instrumenting new services, native histograms are worth adopting from the start rather than retrofitting later.
Long-term storage requires an object store backend: Amazon S3, Google Cloud Storage, Azure Storage, OpenStack Swift, or local filesystem (single-node only).
Optional Components
Beyond the always-on read/write path, Mimir ships several optional components that most production deployments end up running:
- Ruler evaluates recording and alerting rules per tenant, writing results back into Mimir the same way any other client would.
- Alertmanager handles alert routing, grouping, and notification, multi-tenant by default.
- Overrides-exporter exposes per-tenant limit overrides as metrics, useful for capacity planning across tenants.
These run as additional -target values on the same binary, consistent with the rest of Mimir’s deployment model.
Why This Architecture Matters
Mimir’s design addresses key challenges in metrics storage: horizontal scalability, multi-tenancy, high availability through replication, and cost-effective long term storage through block compaction. The separation of read and write paths allows independent scaling based on workload patterns, while the use of object storage backends makes it practical to retain metrics for extended periods without prohibitive infrastructure costs.
Mimir’s design addresses the key challenges of running metrics at scale: horizontal scalability, multi-tenancy, high availability through replication, and cost-effective long-term storage through block compaction. The shift to ingest storage architecture takes this further by decoupling read and write paths almost entirely to allow a spike in query load will no longer risk disrupting ingestion, and vice versa. At the cost of introducing Kafka as an operational dependency and a small amount of read-after-write latency. Combined with native histogram support and ongoing query-engine performance work, Mimir remains a solid, actively evolving path to centralized, long-term Prometheus and OpenTelemetry metrics storage without giving up PromQL or the operational model teams already know.


FAQ
Is Grafana Mimir compatible with Prometheus, or do I need to change my instrumentation?
Mimir accepts data via Prometheus’ remote write API and is compatible with PromQL, so existing Prometheus and Grafana Alloy setups work without changes. It also accepts OpenTelemetry metrics directly, so teams standardized on OTel don’t need a Prometheus intermediary either. See Grafana Mimir architecture and Send metric data.
Should I use classic architecture or ingest storage architecture?
Use ingest storage architecture for new deployments. It’s the stable, preferred option as of Mimir 3.0, and classic architecture (stateful ingesters with local WALs, no Kafka) is set to be deprecated in a future release. See About supported architectures, About ingest storage architecture, and About classic architecture.
Why does Mimir need Kafka?
In ingest storage architecture, Kafka sits between the write and read paths so that heavy query load and heavy write load no longer compete for the same ingester resources. Distributors produce to Kafka and consider the write done once Kafka confirms persistence; ingesters then consume from Kafka asynchronously to build queryable data. See How ingest storage architecture works.
Can query results be stale right after a write?
Yes, briefly. Because ingesters consume from Kafka asynchronously, there’s normally sub-second lag between a write landing in Kafka and it being queryable. Clients that need a strict read-after-write guarantee such as Mimir’s own ruler evaluating dependent rules can set the X-Read-Consistency: strong header to force ingesters to catch up before answering. See Data freshness on the read path.
How does Mimir keep data durable if an ingester crashes?
Each ingester writes incoming samples to a local write-ahead log (WAL) in addition to keeping them in memory, and the WAL should live on persistent disk (for example, an AWS EBS volume, a GCP Persistent Disk, or a Kubernetes StatefulSet with a persistent volume claim) so it survives ingester restarts. On recovery, the ingester replays the WAL and resumes consuming from Kafka at its last committed offset. See The read path.
Where does Mimir actually store long-term data, and what backends are supported?
Mimir persists TSDB blocks to an object store: Amazon S3, Google Cloud Storage, Azure Storage, OpenStack Swift, or a local filesystem for single-node setups. Each block covers a two-hour range by default and contains an index file, metadata, and time series chunks. See Long-term storage.
Why do I see multiple near-duplicate blocks in object storage?
Replication means multiple ingesters each write their own block for overlapping data three-way replication in classic architecture, or one block per consuming ingester in ingest storage architecture, where Kafka handles replication on the write side. The Compactor later merges these into a single deduplicated block, which is what keeps long-term storage costs down. See Series sharding and replication and the Compactor reference.
Does Mimir support native histograms?
Yes. Native histograms are a more storage- and query-efficient histogram type than the traditional bucket-per-series approach, and Mimir supports both Prometheus’ native histograms and OpenTelemetry’s exponential histograms. See Native histograms and OpenTelemetry exponential histograms.
Can Mimir run alerting and recording rules, or do I still need a separate Prometheus for that?
Mimir includes an optional Ruler component that evaluates recording and alerting rules per tenant, plus an Alertmanager for routing and notifying on the resulting alerts — both multi-tenant by default, so you don’t need a separate Prometheus just for rule evaluation. See (Optional) Ruler and (Optional) Alertmanager.
How does Mimir keep large queries fast?
The query-frontend splits long time-range queries into smaller pieces and caches results, while query sharding can split a single query across queriers along the series/label dimension for parallel execution. Mimir has also introduced a newer query engine aimed at reducing memory use by avoiding unnecessary inverted-index lookups in the underlying Prometheus TSDB. See Query-frontend, Query sharding, and Mimir query engine.
Do I need Kubernetes to run Mimir?
No. Mimir compiles all components into a single binary controlled by the -target flag, so you can run it in monolithic mode on one machine to get started, or in read-write mode grouping components by function, before scaling out to a full microservices deployment (on Kubernetes or elsewhere) as load grows. See Deployment modes.







Leave a Reply