
From Dashboards to Decisions: The Four Levels of the Analytics Maturity Model
Updated Date:
If your organization’s idea of “analytics” is a dashboard someone checks once a week, you’re using a fraction of what a modern analytics capability can do. Analytics maturity is not a single skill. It is four progressively harder capabilities, each answering a different business question and requiring different architecture underneath it.
In short: the four levels of analytics maturity are descriptive (what happened), diagnostic (why it happened), predictive (what will happen), and prescriptive (what to do about it). Each level builds directly on the data foundation and tooling of the one before it, and you cannot skip ahead.
| Level | Core Question | Primary Technique | Sign You’ve Arrived |
|---|---|---|---|
| Descriptive | What happened? | Aggregation & visualization | Dashboards are trusted and refreshed on schedule |
| Diagnostic | Why did it happen? | Decomposition, statistics, anomaly detection | Users can self-serve root-cause analysis |
| Predictive | What will happen? | Forecasting, classification, ML | Predictions are monitored and retrained |
| Prescriptive | What should we do? | Optimization, simulation, automation | Recommended actions get executed and outcomes are tracked |
Before any of these levels can be built, there’s a foundational layer that has to exist first, and skipping it is the single most common reason analytics programs stall out.
The Foundation Every Level Depends On
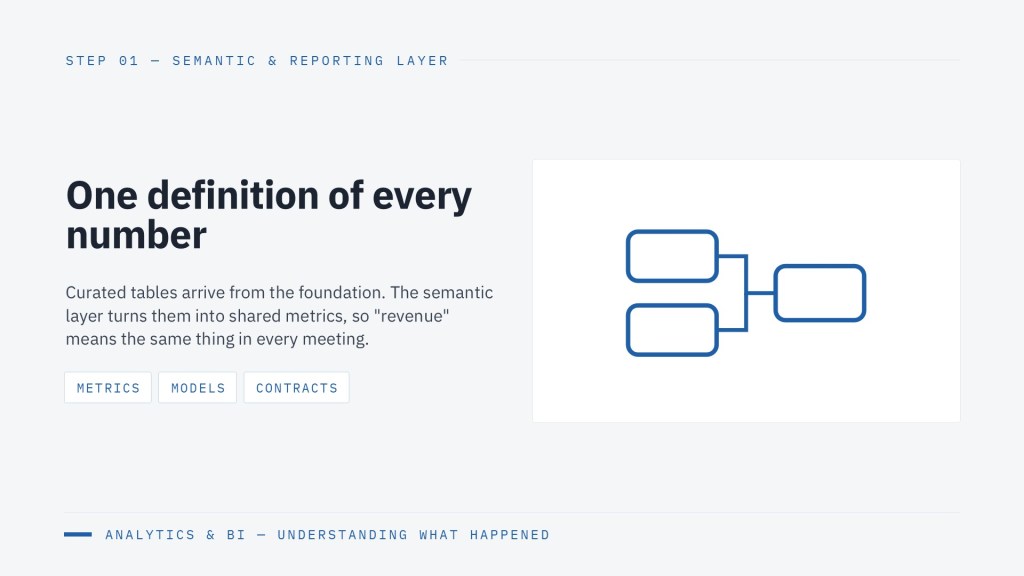
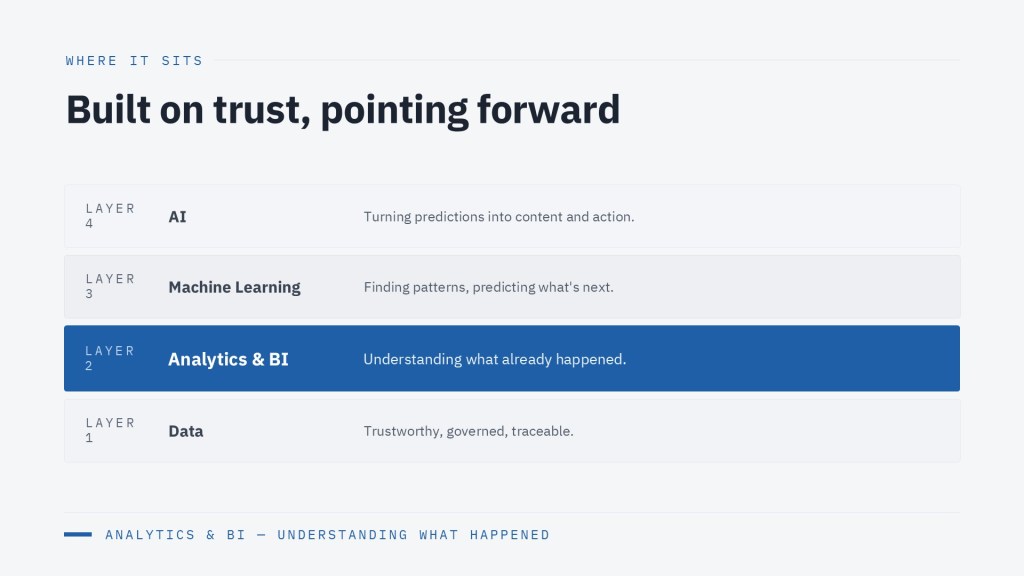
You cannot diagnose, predict, or prescribe anything on top of ungoverned, unmodeled data. Before building any analytics capability, an organization needs:
- Reliable connectivity to source systems typically transactional databases, SaaS applications, streaming feeds, and flat files by using the right ingestion pattern for each (import, direct query, or streaming).
- Data quality and profiling to catch nulls, outliers, and inconsistent values before they reach a report.
- A proper data model with fact and dimension tables in a star schema, not a pile of flat files, with a shared date table for consistent time-based analysis.
- Governance from day one with access controls, row-level security, and a certification process so users know which datasets are production-grade versus exploratory.
Skip this layer and every level built on top of it especially the diagnostic and predictive work will inherit the same data quality and trust problems.
1. Descriptive Analytics: What Happened?
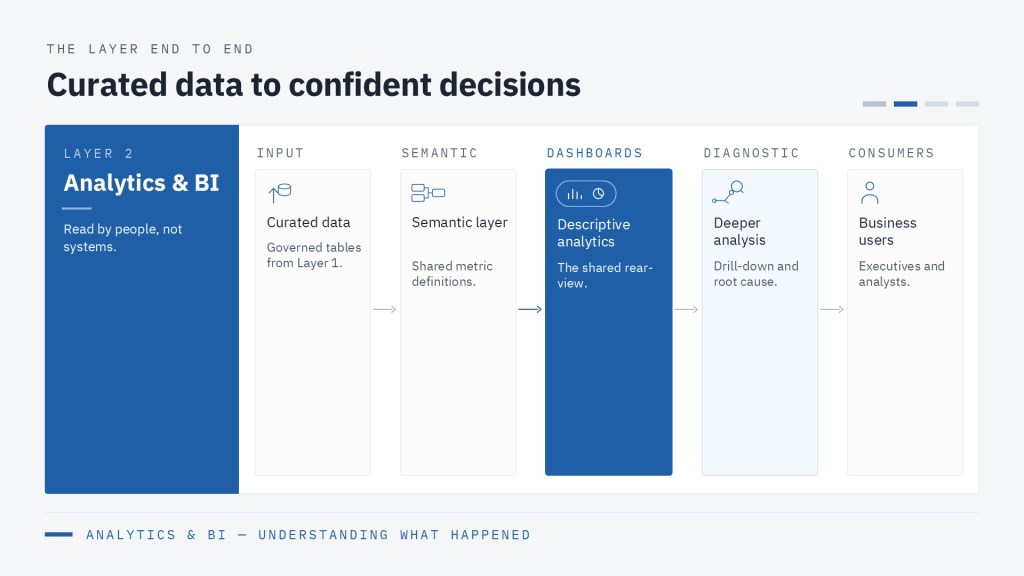
Descriptive analytics is the entry point for almost every analytics program: turning raw data into dashboards, scorecards, and reports that summarize what’s already occurred.
This level requires a measure layer (sums, counts, averages), a reporting layer, and a visualization layer that matches the right chart to the right question with trends as line charts, comparisons as bar charts, part-to-whole relationships as treemaps. Just as important as the visuals themselves is the delivery mechanism: scheduled refreshes, mobile-friendly design, and subscriptions or alerts so stakeholders are pushed information instead of having to go looking for it.
Deliverable: a set of dashboards the business actually trusts, refreshed on a predictable schedule, that answer “what is happening right now, and historically.”
2. Diagnostic Analytics: Why Did It Happen?
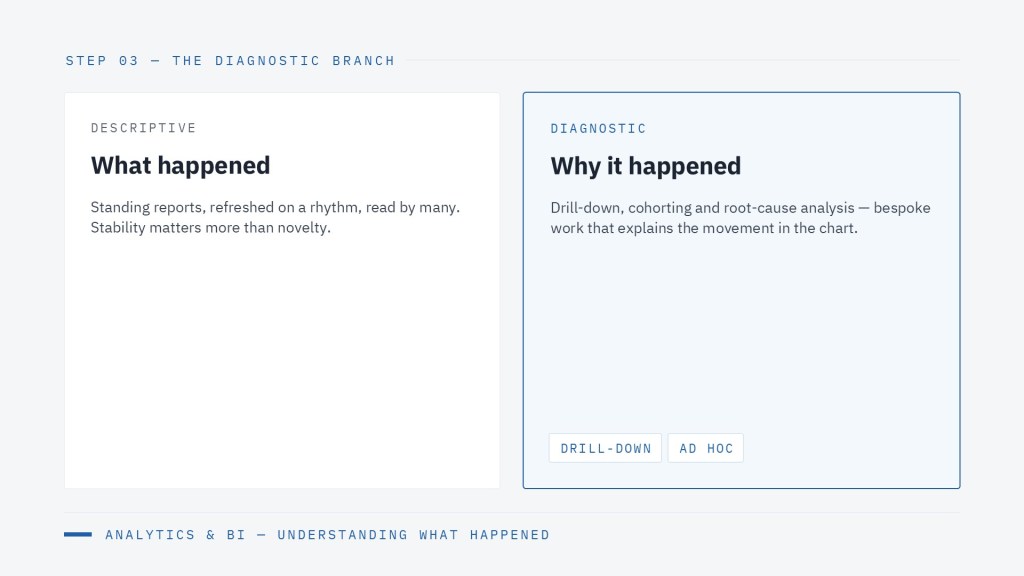
Once people trust the numbers, the next question is always “why did this change?” Diagnostic analytics adds a layer of explanation on top of descriptive reporting.
Architecturally, this means drill-down hierarchies and decomposition trees, statistical functions like variance and correlation built into the model, and time-intelligence measures (year-over-year, rolling averages) that separate seasonal noise from real change. Mature diagnostic capabilities also include automated outlier and anomaly detection, rather than relying on someone eyeballing a chart and noticing something looks off.
Deliverable: a diagnostic layer that lets a business user go from “sales dropped” to “which region, product, or rep drove it” in a couple of clicks without needing an analyst to intervene every time.
3. Predictive Analytics: What Will Happen?
Predictive analytics shifts the organization from explaining the past to forecasting the future. This is where the architecture starts to diverge meaningfully from BI tooling.
Lightweight forecasting with trend lines with confidence intervals directly on a visual that covers low-stakes, short-horizon needs. But forecasts that need to be auditable, retrained on a schedule, and wired into real decision workflows require a proper ML pipeline: a feature store, a training and validation process, and a model registry. This is also where propensity and classification models live, such as, churn risk, lead scoring, fraud likelihood with their scores fed back into the same reporting layer business users already trust.
The part organizations most often underinvest in here isn’t the model, but what happens after deployment: drift detection, accuracy monitoring, and a defined retraining cadence so predictions don’t silently degrade over time.
Deliverable: forecasts and risk scores integrated back into existing reporting and diagnostic views, with monitoring in place to catch when a model needs retraining.
4. Prescriptive Optimization: What Should We Do?
Prescriptive analytics is the most mature and most rarely reached level. It doesn’t just predict an outcome; it recommends or automates the best action given real-world constraints and objectives.
This requires a decision layer where business rules and objectives are formalized, an optimization engine (linear programming, simulation, or reinforcement-learning-based recommendations), and a what-if or scenario layer so decision-makers can test levers for price, staffing, or budget before committing. The final and most commonly missing piece is the action layer: the mechanism that actually turns a recommendation into an executed action, whether that’s an automated reorder point, a dynamic pricing update, or a next best action prompt for a sales team.
Deliverable: a decision-support or decision-automation system where recommended actions and not just numbers reach the people or systems that act on them, with a feedback loop measuring whether the action actually worked.
Why the Order Matters
These four levels aren’t independent projects. Instead they are sequential dependencies. A predictive model built on ungoverned data will produce untrustworthy forecasts. A prescriptive optimization layer built before predictive scoring exists has nothing reliable to optimize against. The recommended build sequence is:
- Foundation : connect sources, model into a star schema, establish governance
- Descriptive: ship trusted dashboards and KPIs; win organizational buy-in on a single source of truth
- Diagnostic: add drill-down, anomaly detection, and explain-the-change capability on the same model
- Predictive: introduce forecasting and scoring, starting lightweight before investing in full ML pipelines
- Prescriptive: once predictions are trusted and monitored, layer in optimization and automated action
Each level should reuse the same governed data model rather than forking a separate pipeline. This will keeps descriptive, diagnostic, predictive, and prescriptive views consistent with each other instead of becoming four disconnected sources of truth.
The Maturity Model Mirrors the Leadership Model
The progression from descriptive to prescriptive analytics has a parallel in how data leadership itself has evolved. As Gopal, Davenport, and Bean describe in Harvard Business Review article (December 2025), the Chief Data Officer role emerged after the 2008–09 financial crisis as a defensive function focused on risk, compliance, and reliable reporting: essentially the foundation and descriptive layers. As organizations matured, the role expanded into the Chief Data and Analytics Officer, shifting from defense to offense by using analytics to drive growth. That is the move from “what happened” toward “what should we do.” Now AI is pushing a third expansion, into a combined Chief Data, Analytics, and AI Officer. The authors’ executive checklist asks whether AI KPIs are measured at least quarterly and whether the organization pivots based on them. That question can’t be answered without the trusted descriptive and diagnostic layers described above. Analytics is the measurement system that proves whether data and AI investments are paying off. It is also why a single accountable leader matters: when descriptive reporting, predictive scoring, and prescriptive automation report into different executives, they tend to drift into four disconnected sources of truth instead of one governed model.
Frequently Asked Questions
What are the 4 types of analytics? Descriptive (what happened), diagnostic (why it happened), predictive (what will happen), and prescriptive (what should be done). They form a maturity progression, not a menu of unrelated options.
Which type of analytics is hardest to implement? Prescriptive analytics is the most technically and organizationally demanding, because it requires trustworthy predictive models, a formalized decision/optimization layer, and a mechanism to actually execute recommended actions, plus a feedback loop to confirm the action worked.
Do you have to do all four levels in order? Yes, functionally. Each level depends on the data foundation and trust built by the one before it. Organizations that try to jump straight to predictive or prescriptive analytics without governed data and trusted descriptive reporting typically end up with models nobody trusts enough to act on.
What’s the difference between diagnostic and predictive analytics? Diagnostic analytics explains why something already happened, using drill-downs and statistical analysis on historical data. Predictive analytics forecasts what will happen next, using models trained on historical patterns.