

Updated Date:
The Grafana observability stack (LGTM) combines Alloy for telemetry collection, Tempo for traces, Mimir for metrics, Loki for logs, and Grafana for visualization, with Pyroscope adding continuous profiling and MCP enabling AI agent access to the data.
In today’s data-driven landscape, organizations rely on complex systems and integrations to process, transform, and deliver critical information. When something goes wrong, and it will. Having a robust observability is the difference between hours of frustrated debugging and quickly identifying and resolving issues. Observability rests on a set of foundational signals that work together to provide complete visibility into your systems: metrics, traces, logs, and increasingly continuous profiles. Each pillar serves a distinct purpose, and together they create a comprehensive framework for understanding the health and performance of your infrastructure.

Metrics serve as your early warning system, answering the crucial question: what went wrong? These quantitative measurements like response times, volume anomalies, system usage, or success rates act as vital signs for your data ecosystem. When a metric crosses a threshold or exhibits unusual patterns, it immediately alerts teams that something requires attention. Metrics provide the high-level view that helps you quickly assess whether systems are working as expected, whether quality is degrading, or whether performance is suffering. They’re your first line of defense, offering the bird’s-eye perspective needed to triage issues before they cascade into larger problems.
Once metrics identify an issue, traces help you pinpoint where it occurred by mapping the journey through your systems. Traces follow lineage across integrations, and system dependencies, creating a visual map of how well business applications are operating. This pillar is invaluable for understanding complex, distributed systems where a single element might touch dozens of services. When a metric signals a problem, traces quickly narrow down which specific component or integration point is the culprit.
Finally, logs provide the granular detail that explains why the issue happened. These detailed records capture events, errors, and contextual information at multiple viewpoints. Logs are where you find the stack traces, error messages, and specific conditions that caused a failure. Together, these three pillars create a complete observability framework where metrics tell you there’s a problem, traces show you where to look, and logs explain what you need to fix.
Grafana
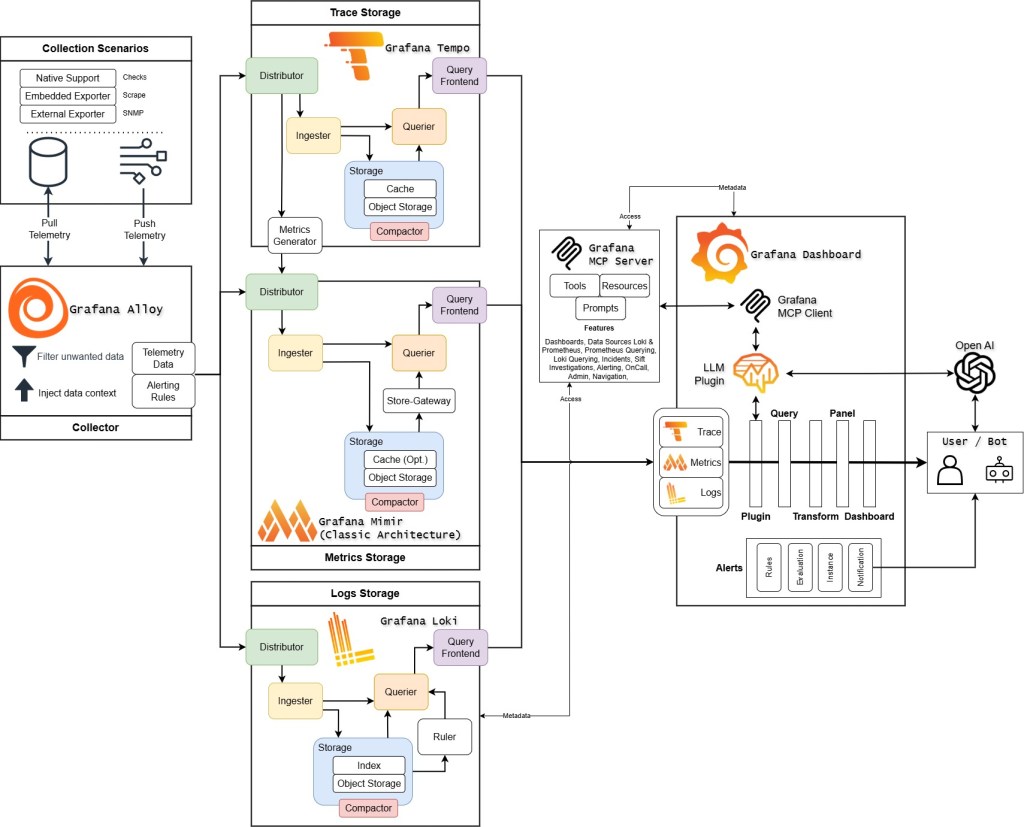
The Grafana observability stack provides an integrated, open-source platform for collecting, storing, and analyzing telemetry data across distributed systems. The architecture separates concerns into specialized components, each optimized for specific data types and query patterns while maintaining interoperability through common protocols and APIs.
Alloy: Unified Telemetry Collection
Grafana Alloy serves as the telemetry collection layer, replacing the previous generation of agents (Grafana Agent, Prometheus Agent). Built on OpenTelemetry foundations, Alloy provides a vendor-neutral ingestion pipeline that can receive, process, and forward metrics, logs, traces, and profiles. It operates as a lightweight agent deployable as a sidecar, DaemonSet, or standalone collector, and supports dynamic configuration through a declarative pipeline language. Alloy handles protocol translation, data enrichment, filtering, and routing, allowing teams to normalize heterogeneous telemetry sources before they reach storage backends. Its component-based architecture enables flexible data transformation pipelines while maintaining low resource overhead, making it suitable for high-cardinality environments.
Tempo: Distributed Tracing at Scale
Tempo is a horizontally scalable, cost-efficient distributed tracing backend that stores trace data in object storage (S3, GCS, Azure Blob) rather than requiring expensive indexing infrastructure. Unlike traditional tracing systems that index all span attributes, Tempo uses a minimal indexing strategy by only indexing trace IDs by default which dramatically reduces storage and operational costs. It natively supports multiple ingestion formats including Jaeger, Zipkin, and OpenTelemetry Protocol (OTLP). Tempo’s architecture separates the write path (distributors and ingesters) from the read path (queriers), enabling independent scaling. The TraceQL query language provides powerful trace search and filtering capabilities based on span attributes, duration, and structure without requiring pre-defined indexes. Tempo integrates deeply with Grafana’s exemplars feature, linking metrics to traces for seamless correlation between aggregated metrics and detailed trace data.
Mimir: Horizontally Scalable Metrics
Grafana Mimir is a long-term storage solution for metrics, designed for massive scale and multi-tenancy. It implements the Prometheus remote write API and PromQL query engine while adding horizontal scalability through a microservices architecture with components for ingestion (distributors, ingesters), query (queriers, query-frontend), and compaction. Mimir stores data in object storage with a block-based format inherited from Prometheus TSDB. The query-frontend provides intelligent query splitting and caching, significantly improving query performance for large time ranges. Mimir’s architecture enables independent scaling of read and write paths, making it suitable for environments with thousands of Prometheus instances and petabytes of metrics data. Grafana Mimir: A Technical Architecture Overview – Ross McNeely
Loki: Log Aggregation Without Full-Text Indexing
Loki takes a fundamentally different approach to log aggregation compared to traditional solutions like Elasticsearch. Instead of indexing log contents, Loki only indexes metadata labels (similar to Prometheus labels), storing log lines as compressed chunks in object storage. This design choice dramatically reduces storage and operational costs while maintaining fast queries for labeled log streams. LogQL, Loki’s query language, supports grep-like filtering, pattern extraction, and metric aggregation from logs. Loki’s architecture mirrors Prometheus with distributors, ingesters, and queriers, enabling horizontal scalability. The key insight is that most log queries filter by metadata (service, pod, namespace) before searching content, making full-text indexing unnecessary for many use cases. Loki supports structured metadata extraction and log-to-metrics conversion, allowing teams to derive metrics from log data without maintaining separate instrumentation. A Grafana Loki Overview – Ross McNeely
Pyroscope: Continuous Profiling as the Fourth Signal
Where metrics tell you what went wrong, traces show where, and logs explain why, Grafana Pyroscope answers a narrower but increasingly essential question: which line of code is costing you. Pyroscope is a continuous profiling database that collects CPU and memory profiles from applications on an ongoing basis, rather than requiring someone to manually capture a profile after a problem is already underway. Because profiles are collected continuously and pushed to a server, the profile from an incident exists whether or not anyone thought to grab it during the incident itself.
Architecturally, Pyroscope mirrors its siblings: it’s horizontally scalable, stores data in object storage (S3, GCS, Azure Blob, or any S3-compatible store), and follows the same distributor/ingester/querier pattern used by Mimir, Loki, and Tempo which keeps the operational learning curve flat for teams already running the rest of the stack. Data can reach Pyroscope in either pull mode, where Grafana Alloy scrapes profiles from applications exposing a pprof-compatible endpoint (the same model Prometheus uses for metrics scraping), or push mode, where Pyroscope’s language SDKs send profiles directly from the application.
The payoff is correlation, not just another dashboard. Pyroscope integrates with Grafana’s flame graph, histogram, and table visualizations, and profiling data can be linked to trace spans so a slow span in Tempo can be traced down to the exact function consuming the CPU or memory budget. Grafana Labs now treats profiling as a core building block of the stack alongside metrics, logs, and traces the reference LGTM demo image (grafana/docker-otel-lgtm) bundles Pyroscope by default alongside Prometheus, Tempo, Loki, and Grafana. Teams that skip it aren’t misconfigured, but they’re missing the one signal that turns “the service is slow” into “this function, this line, this allocation.”
Sources:
- Grafana stack overview (Mimir/Loki/Tempo/Pyroscope as the “LGTM+” building blocks): https://grafana.com/about/grafana-stack/
- Pyroscope data source docs: https://grafana.com/docs/grafana/latest/datasources/pyroscope/
- Pyroscope OSS product page (architecture, object storage, scaling model): https://grafana.com/oss/pyroscope/
- Sending profile data via Alloy or SDKs (Grafana Cloud docs): https://grafana.com/docs/grafana-cloud/monitor-applications/profiles/send-profile-data
- Profile types / correlation with other signals: https://grafana.com/docs/grafana/latest/visualizations/simplified-exploration/profiles/concepts/profile-types/
grafana/docker-otel-lgtmbundling Pyroscope as the fourth database: https://grafana.com/blog/observability-in-under-5-seconds-reflecting-on-a-year-of-grafana-otel-lgtm/
Grafana Dashboards: Unified Visualization and Correlation
Grafana provides the query and visualization layer that unifies data from Tempo, Mimir, Loki, and other data sources. Its dashboard system supports mixed data sources within single visualizations, enabling correlation between metrics, logs, and traces. Grafana’s data links and exemplars create navigable connections. Clicking a metric spike can jump directly to related logs or traces. The Explore interface provides ad-hoc query capabilities optimized for each data source type, with specialized UI for building PromQL, LogQL, and TraceQL queries. Grafana supports alerting based on queries against any connected data source, with alert rules evaluated by a separate Grafana Alertmanager-compatible engine. Templating and variables enable dynamic, reusable dashboards that adapt to different environments and services. The plugin architecture allows extension through custom panels, data sources, and applications, while the RBAC system enables fine-grained access control for enterprise deployments.
Grafana MCP Integration: Model Context Protocol
Grafana’s Model Context Protocol implementation enables AI agents and Large Language Models to interact directly with observability data through standardized interfaces. The MCP server exposes Grafana’s data sources, dashboards, and query capabilities as structured resources and tools that AI systems can discover and utilize. This allows LLMs to execute PromQL, LogQL queries, retrieve dashboard configurations, analyze time-series data, and correlate signals across metrics, logs, and traces without custom integrations. The protocol handles authentication, rate limiting, and query validation while maintaining the security boundaries of Grafana’s existing RBAC system. MCP enables use cases like natural language querying of observability data, automated incident analysis, intelligent alert triage, and AI-assisted dashboard creation. By standardizing how AI systems access observability telemetry, MCP positions Grafana as a first-class data source for AI-powered operational workflows, allowing teams to leverage LLMs for root cause analysis, anomaly explanation, and predictive insights without building custom API wrappers or data export pipelines.
Grafana Assistant: The First-Party AI Agent
While MCP standardizes how external AI agents and LLMs reach into Grafana’s data, Grafana Assistant is Grafana Labs’ own agent built directly on top of that data — now generally available in Grafana Cloud and accessible from self-managed OSS and Enterprise deployments via a one-click connection back to a Cloud Assistant backend. Rather than requiring users to learn PromQL, LogQL, or TraceQL, Assistant takes plain-language questions like “show me CPU usage” or “create a dashboard for my database” and works across metrics, logs, traces, profiles, and connected databases to produce an answer.
Assistant is organized around a handful of core workflows rather than being a general-purpose chatbot bolted onto the UI. It can run guided, multi-step incident investigations that correlate metrics, logs, traces, profiles, and SQL data, following the kind of logical inquiry path an experienced SRE would take, and it can run several of these investigations in parallel. It builds and edits dashboards conversationally, carrying forward context discovered earlier in the conversation. It understands Grafana’s own navigation — URLs, apps, and object types — so it can take a user directly to a relevant panel, alert, or SLO instead of just describing where one might be. And because it runs inside Grafana, conversations respect the same RBAC boundaries as everything else in the platform, with queries and actions routed through vetted service providers.
Since its GA announcement, Assistant’s scope has expanded quickly: it now correlates data across more than 30 connected data sources, not just the native LGTM stack, positioning it as a general investigation layer across whatever a team has plugged into Grafana. For teams evaluating where to invest first, MCP is the right choice when you’re building or connecting your own AI tooling to Grafana’s data; Grafana Assistant is the right choice when you want that AI layer ready to use out of the box, with Grafana’s own product knowledge and RBAC model built in.
Sources:
- Grafana Assistant product page: https://grafana.com/products/cloud/ai-assistant/
- Get started with Grafana Assistant (workflows, five core capabilities): https://grafana.com/docs/grafana-cloud/machine-learning/assistant/get-started/
- Grafana Assistant docs (RBAC, self-managed connection model): https://grafana.com/docs/grafana-cloud/machine-learning/assistant/
- GA announcement and Investigations feature: https://www.businesswire.com/news/home/20251008705742/en/Grafana-Labs-Revolutionizes-AI-Powered-Observability-with-GA-of-Grafana-Assistant-and-Introduces-Assistant-Investigations
- Original preview announcement (navigation, dashboarding-by-conversation): https://grafana.com/blog/llm-grafana-assistant/
- Expansion to 30+ data sources: https://www.infoq.com/news/2026/07/grafana-assistant-data-source/
The Grafana stack power lies in its cohesive design: shared label conventions between Mimir and Loki enable correlated queries, exemplars link metrics to traces, and Alloy ensures consistent metadata enrichment across all telemetry types. This creates a unified observability platform where context flows naturally between different telemetry signals.
Frequently Asked Questions (FAQ) Section on Grafana
What is the Grafana LGTM stack?
The LGTM stack is Grafana Labs’ open-source observability platform, named for its four core components: Loki for logs, Grafana for visualization, Tempo for traces, and Mimir for metrics. Grafana Alloy sits alongside these as the unified telemetry collector, and Pyroscope has increasingly been added as a fifth component for continuous profiling — Grafana Labs now refers to the full set as “LGTM+” in its own stack materials. (Grafana Stack overview)
What is Grafana Alloy and why did it replace Grafana Agent?
Grafana Alloy is Grafana Labs’ unified telemetry collector, built as a distribution of the OpenTelemetry Collector with native support for Prometheus metrics and built-in pipelines to Loki, Tempo, and Pyroscope. It replaced Grafana Agent and Prometheus Agent as the recommended collection layer because it consolidates what used to be several separate agents into one configurable pipeline. (Introduction to Grafana Alloy)
Is Promtail deprecated?
Yes. Promtail reached end of life on March 2, 2026 — commercial support has ended and no further updates or feature development will occur. Grafana Labs directs all Promtail users to migrate to Grafana Alloy, which includes a migration tool that converts existing Promtail configs to Alloy configs with a single command. (Promtail agent docs)
What is Grafana Mimir used for?
Grafana Mimir is a horizontally scalable, long-term storage backend for Prometheus metrics, built to handle multi-tenant environments at massive scale. It implements the Prometheus remote-write API and PromQL query engine directly, so existing Prometheus tooling works against it without changes, while adding the ability to scale to billions of active series using object storage rather than local disk. (Grafana Mimir docs)
How is Grafana Loki different from Elasticsearch for log storage?
Loki only indexes metadata labels (like service, pod, or namespace) rather than full log content, storing the log lines themselves as compressed chunks in object storage. This trade-off is what keeps Loki’s storage and operational costs low compared to full-text-indexed systems like Elasticsearch, on the premise that most log queries filter by label first and search content second. (Grafana Loki documentation)
What is Grafana Tempo and how does it keep tracing costs down?
Tempo is Grafana Labs’ distributed tracing backend, and it keeps costs low by indexing only trace IDs by default rather than every span attribute, storing the trace data itself in object storage instead of an expensive search index. It ingests traces in Jaeger, Zipkin, and OpenTelemetry (OTLP) formats and is queried using TraceQL. (Grafana Tempo documentation)
Does Grafana support continuous profiling?
Yes, through Grafana Pyroscope, which continuously collects CPU and memory profiles from applications and stores them in object storage using the same distributor/ingester/querier architecture as Mimir, Loki, and Tempo. Profiling data can be correlated with trace spans, letting you trace a slow request down to the specific function or allocation responsible. (Pyroscope data source docs)
What is the Grafana MCP server used for?
Grafana’s MCP (Model Context Protocol) server exposes Grafana’s dashboards, data sources, and query capabilities as structured tools that external AI agents and LLMs — like Claude or custom-built agents — can call directly. It supports granular, RBAC-scoped access, letting administrators enable or disable entire tool categories (like OnCall or navigation tools) depending on what a given AI client should be allowed to touch. (grafana/mcp-grafana on GitHub)
What’s the difference between Grafana MCP and Grafana Assistant?
MCP is an open protocol for connecting external AI agents and LLMs to Grafana’s data — it’s the integration point you’d use if you’re building your own AI tooling. Grafana Assistant is Grafana Labs’ own first-party AI agent, built on top of that same data and generally available directly inside Grafana Cloud, letting users ask natural-language questions, run guided incident investigations, and build dashboards conversationally without any custom integration work. (Grafana Assistant docs)
Is the Grafana observability stack open source?
Yes. Alloy, Tempo, Mimir, Loki, Pyroscope, and Grafana itself are all open-source projects that can be self-hosted, and Grafana Labs also offers a fully managed version of the same stack through Grafana Cloud. The architecture is designed so the same components and query languages (PromQL, LogQL, TraceQL) work whether you’re running self-managed or in the cloud. (Grafana Stack overview)





Leave a Reply