
If you’re producing anywhere from tens to millions of logs and looking for a better way to collect, store, and query them, Grafana Loki might be exactly what you need. Loki brings a simple approach to log aggregation that’s both powerful and affordable to run.
What is Loki?
Grafana Loki is a horizontally-scalable, highly-available log aggregation system designed to make log management less painful and more cost-effective. Unlike traditional logging systems that index every word in your logs, Loki takes a different approach by only indexing metadata about your logs using labels.
Think of it as instead of creating a massive searchable database of every log line, Loki organizes your logs into streams based on labels like {app=”frontend”, environment=”production”} and stores the actual log content in highly compressed chunks. This simple decision makes Loki dramatically cheaper to operate while still giving you powerful querying capabilities.
Why use Loki?
Cost-Effective at Any Scale: Whether you’re running a small research project on a Raspberry Pi or ingesting petabytes of logs daily, Loki’s architecture keeps costs reasonable. By storing compressed logs in cheap object storage like Amazon S3 or Google Cloud Storage, you’ll typically spend far less than with traditional logging platforms.
Multi-Tenant by Design: Need to separate logs for different teams or customers? Loki supports multi-tenancy out of the box, keeping each tenant’s data completely isolated while sharing infrastructure efficiently.
How It Works
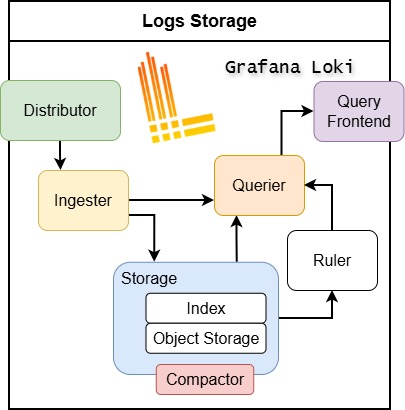
Getting logs into Loki is straightforward. You deploy an agent (like Grafana Alloy or Promtail) alongside your applications. These agents collect logs, attach labels to create streams, and push them to Loki over HTTP.
Once in Loki, your logs are compressed, chunked, and stored in object storage. The label index remains small and fast, making queries fast even across huge volumes of data. When you need to find something, you query using LogQL through Grafana’s interface, LogCLI for command-line access, or the API directly.
Beyond Simple Log Storage
- Loki isn’t just about storing and searching logs. It includes powerful features that make it a complete logging solution…
- Metrics from Logs: LogQL lets you extract metrics from your log data on the fly. Found an interesting pattern in your logs? Turn it into a time-series metric and create dashboards or alerts around it with no need to instrument your code.
- Built-in Alerting: The ruler component continuously evaluates LogQL queries against your incoming logs, triggering alerts when it finds what you’re looking for.
- Complete Observability: Loki integrates seamlessly with Grafana for visualization, Mimir for metrics, and Tempo for traces. This unified stack lets you correlate logs, metrics, and traces effortlessly when debugging issues. See a spike in error metrics? Jump directly to the relevant logs and traces.
- Flexible Agent Support: While Grafana Alloy and Promtail are the official agents, many third-party tools have Loki plugins. This means you can often integrate Loki into your existing observability setup without replacing everything.
Getting Started
Loki allows you to start experimenting today with minimal setup. Deploy Loki locally using Docker, install Promtail to ship some logs, and connect Grafana to visualize them. The entire stack can run on a laptop, letting you evaluate whether Loki fits your needs before committing to a production deployment. The same concepts and queries that work on your laptop scale to production workloads.

Leave a reply to Grafana Observability Stack Overview – Ross McNeely Cancel reply