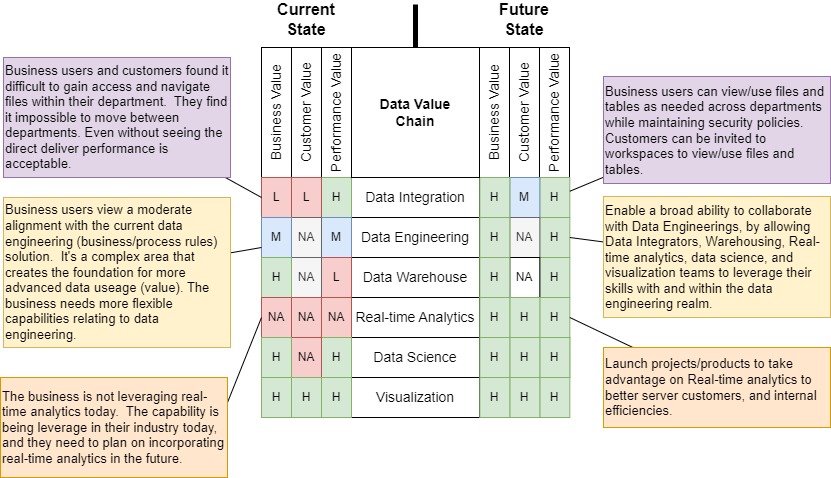
Business Analysis professionals use the Capability Analysis tool to visually show alignment of the current state and future state. In the example below I used a generic current state, but the future state is intended to be Microsoft Fabric focused. Creating multiple Capability Analysis diagrams may be needed if multiple platforms are being considered for the future state. There are multiple evaluations occurring for Business, Customer, and Performance Value along the central vertical that represents the Data Value Chain. In my opinion Microsoft Fabric works to shorten the data value chain allowing your organization to benefit from data assets more efficiently. The data value chain provides key data management principles in Data Integration, Data Engineering, Data Warehousing, Real-time Analytics, Data Science and Data Visualization. Analyzing new tools and platforms by the Business, Customer, and Performance provides a deeper impact analysis than just performance along. Multiple points-of-view will help add insights from the business and operations side and highlighting any gaps in any future platform.
References: International Institute of Business Analysis. (2015). A guide to the business analysis body of knowledge (BABOK guide) (3rd ed.). Author.
The example above will start aligning the business needs with MS Fabric. The goal is to identify technical alignment between current state capabilities and future state that will support data management principles and deliver key business capabilities. This is not solely an evaluation of the technical capabilities. The purpose is to help generate a shared understanding of the capability expectations based on the business, customer, and performance points-of-view. Creating a Capability Analysis chart will require cross-departmental collaboration to achieve a cohesive assessment. An additional benefit of a joint analysis across departments is assessing the dependencies and criticality of any identified risk to your organization’s core capabilities.
Here are some questions from Microsoft’s ebook titled “Unlocking Transformative Data Value with Microsoft Fabric” that will help drive discovery during your cross-departmental collaborations:
How can we enable innovation with data and analytics for your department?
What innovation can we enable?
How can I make your line of business more efficient?
What immediate initiatives can we collaborate on and how will we measure the impact?
What business value will we deliver over time Cost reduction? Revenue generation?
How can I better enable your line of business to use data in decision-making?
What security and governance concerns should we be aware of?
Is there third-party of IoT data that could enrich your insights?
While you are creating the Capability Analysis chart remember your future state should generally target either a lakehouse, warehouse, machine learning, or real-time analytical solutions. Be sure to create a backlog of other Digital Transformation ideas you hear to help build new use cases for integration.


Leave a comment